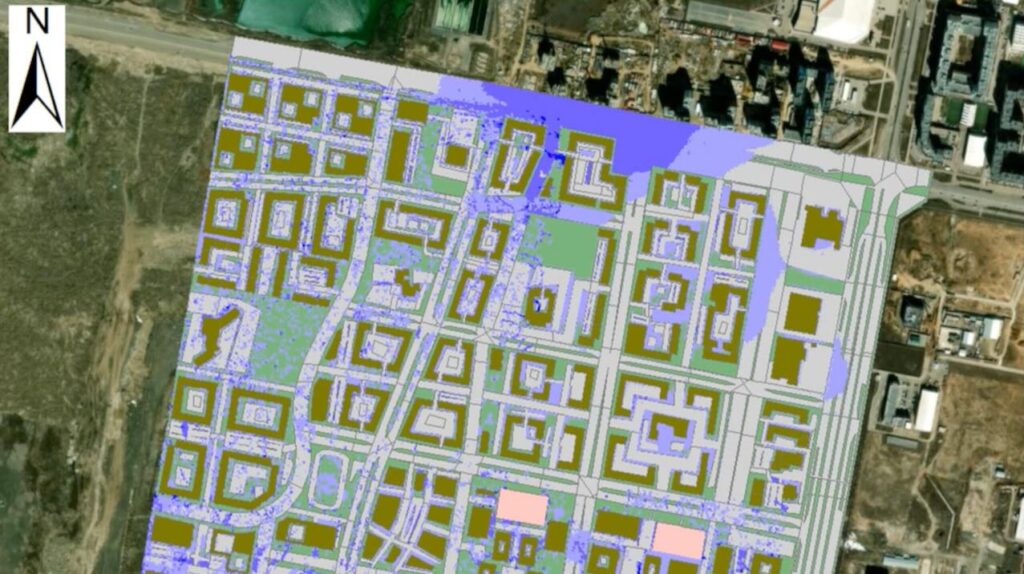
A. Pilot area
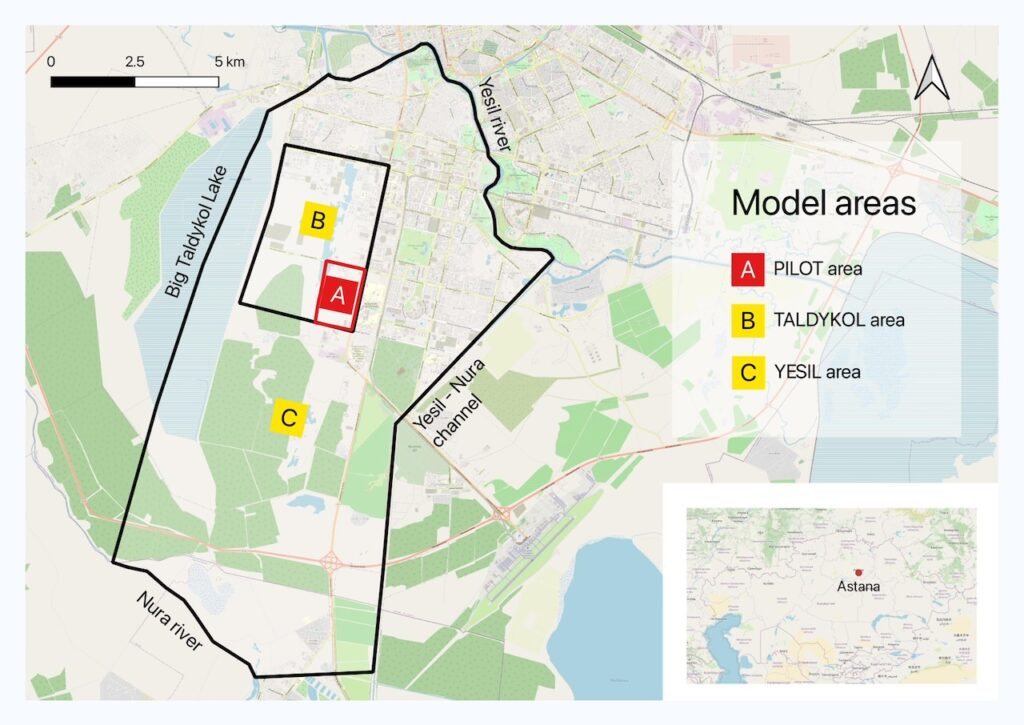
The Pilot area is located on the left banks of the Yesil river in the immediate vicinity of the Nazarbayev University campus. The area is currently under development, partially covered by residential blocks but also having still open, bare land. For the simulation works conducted in the TERESA project, the official urban development plan has been digitalised and considered as base scenario for all project simulations. The aim of the modelling at the Pilot area is to estimate the efficiency of sustainable urban development systems (SUDS) in terms of reduction of surface runoff, increase in evaporation and infiltration, reduction of water levels caused by floods in case of heavy rainfall events, as well as impact on groundwater levels in the underlying aquifers.
STORMWATER MANAGEMENT
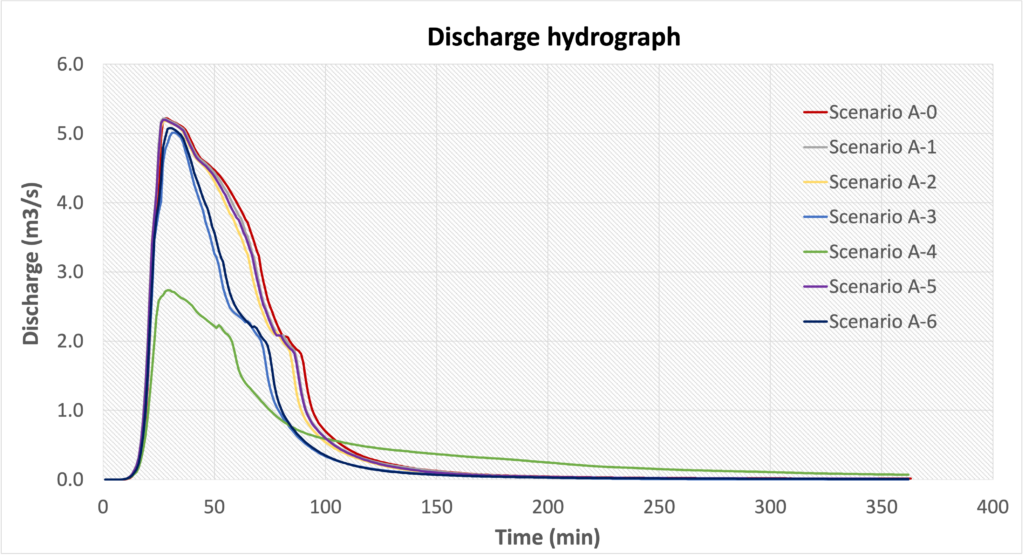
Result A-01
Discharge hydrograph for 6h simulation
Comparison of discharge hydrographs for all simulated scenarios with values calculated at the most NE outlet – chart
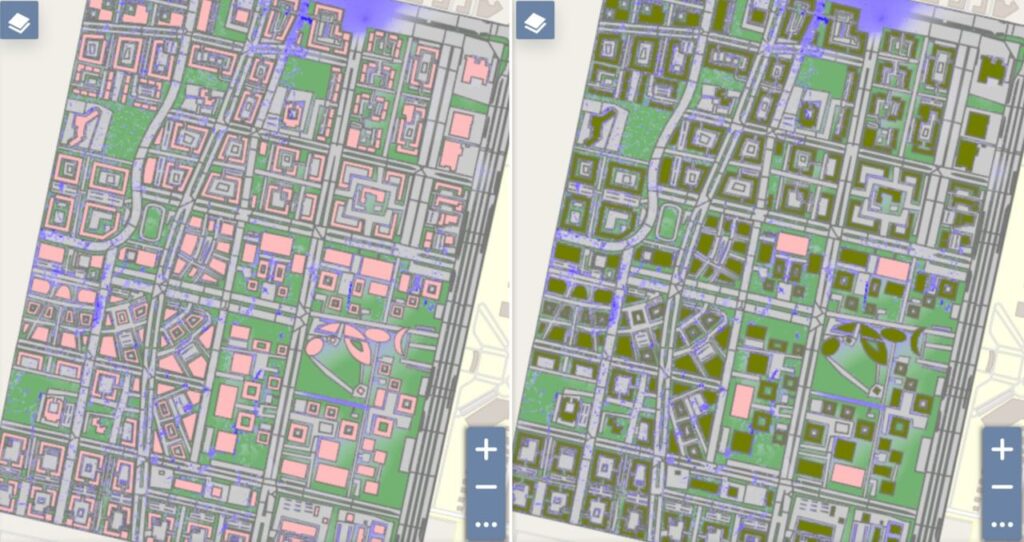
Result A-02
Maximum water levels – comparison scenarios
Comparison between maximum flood water levels calculated in different scenarios for two design storms of 23 and 33.6 mm – interactive maps
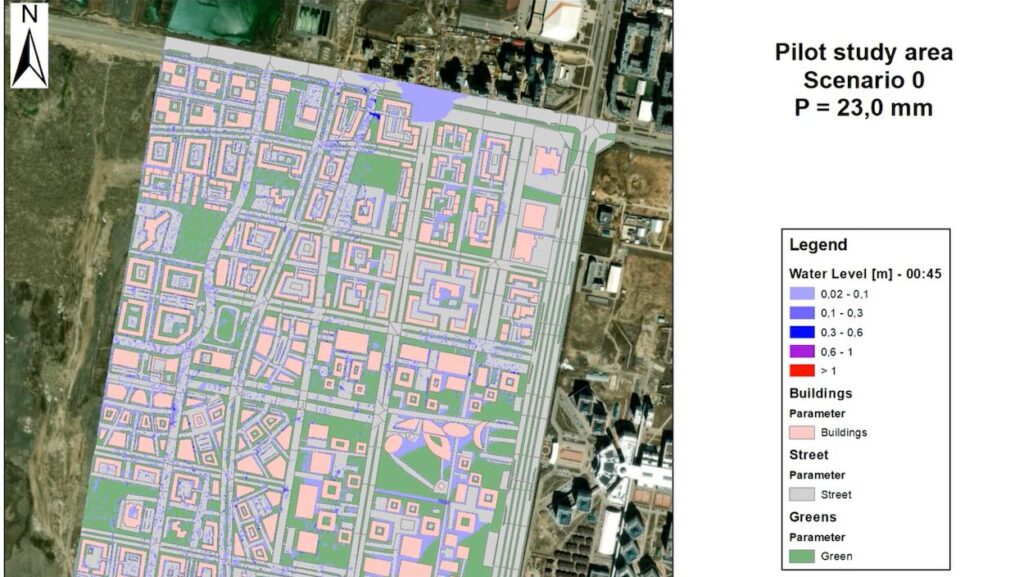
Result A-03a
Flood water levels for a design storm with 5-years return period
Flood water levels in the study area during a design storm with a precipitation amount (P) of 23 mm, a return period (T) of 5 years and a duration (D) of 60 minutes – videos
Result A-03b
Flood water levels for a design storm with 30-years return period
Flood water levels in the study area during a design storm with a precipitation amount (P) of 33.6 mm, a return period (T) of 30 years and a duration (D) of 60 minutes – videos
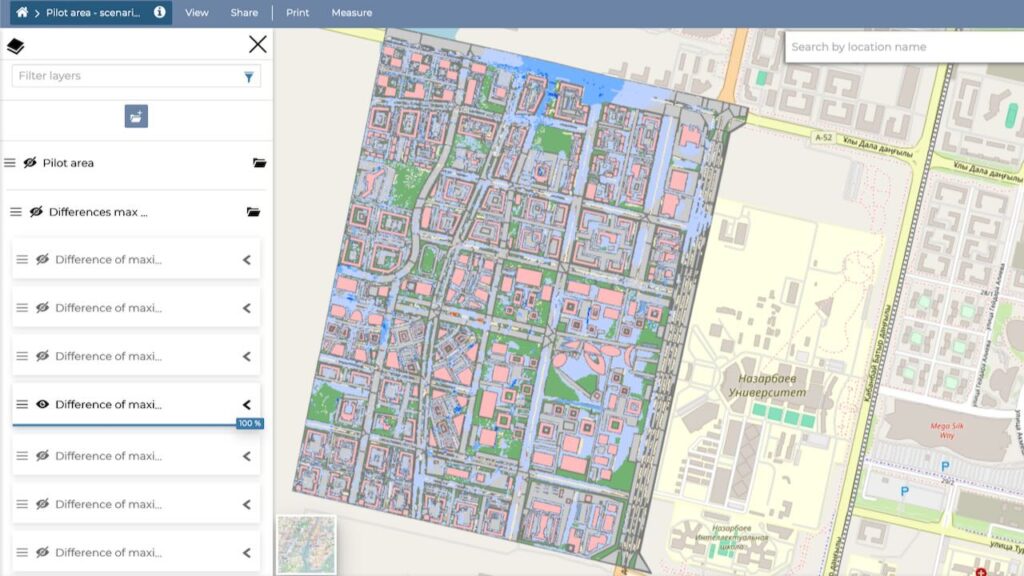
Result A-04
Maximum water levels – scenarios difference
Difference between scenarios: maximum water levels for a design storm with a precipitation of 33.6 mm, a return period (T) of 30 years and a duration of 60 minutes – maps

Result A-05
Water balance for the reference year 2010
Water balance for reference year 2010 – chart
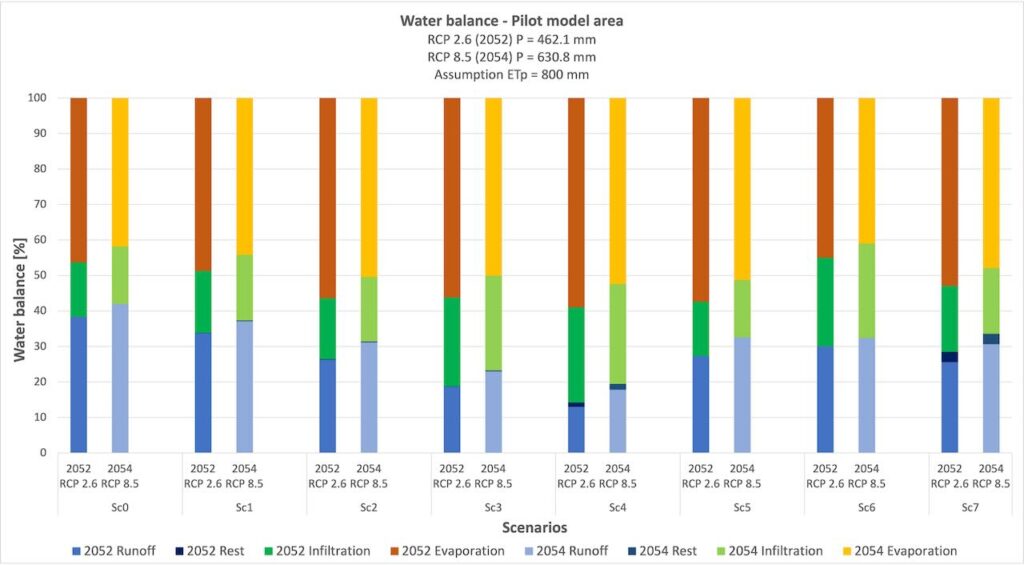
Result A-06
Climate projections: water balance for future dry and wet years
Climate projections: water balance for future dry and wet years – chart
GROUNDWATER MANAGEMENT
Result A-11
Historical seasonal fluctuations of groundwater levels
Fluctuations of groundwater levels under historical conditions (pervious area before the implementation of urban development plan)
- Discharge hydrograph (Excel)
- Max water levels for each scenario (shapefile)
- Water levels in the study area after 60 min rain with return period of 5 years (P = 23 mm) – VIDEO
Water levels in the study area after 60 min rain with return period of 30 years (P = 33.6 mm) – VIDEO - Max water levels for scenarios differences (shapefiles)
- Water balance for 2010 as reference (Excel)
- Water balance for one dry year and one wet year – climate projections (Excel)
TUD
- Groundwater levels – seasonal fluctuations (time series raster or shapefiles for difference)
- Groundwater levels influenced by lakes, 1 raster / month for 12 months (comparison scenarios w/o lake), – shapefiles + chart (Excel)
- Maximum groundwater levels in wet / dry years – climate projections (shapefiles + counter widget)
- Groundwater levels influenced by SUDS vs. base scenario (same scenarios as in 2) (shapefiles)